Market update: MARCH 2017
The $US200 trillion global debt mountain – how big a threat is it really and what are the implications for investors?
Introduction
Excessive debt tends to be at the centre of most scare stories regarding the investment outlook – whether they relate to China, public debt in developed countries, corporate debt in the US or Australian household debt. The standard debt related scare story runs something along the lines of “we have lived beyond our means. Any attempt to prevent a debt implosion won’t work or will just delay the inevitable. Divine retribution will get us in the end!” One big debt scare that gets wheeled out is that total global debt outstanding has reached a new record high of nearly $US200 trillion and either that on its own or in combination with any significant rise in global interest rates will trigger the next crisis. To be sure problems with debt or a desire to reduce it are part and parcel of most financial crises and economic downturns. And total global debt has indeed reached record levels. But that’s not the same as saying another financial crisis is imminent. This note looks at the main issues.
Global debt – first some facts
Excluding the debt of financial companies like banks (to avoid double counting) total gross world public and private debt is around $US170 trillion. That is a record high big scary number but it’s meaningless unless it’s compared to something. An obvious comparison is to income levels and the best guide to that at an economy wide level is GDP. Again new records have been reached with gross world public and private non-financial debt rising to a record of 235% of global GDP.
Since the global financial crisis (GFC) the climb in overall debt has been due to rising public debt in the developed world (DM) and rising private debt in the emerging world (EM). The rise in developed world public debt reflects GFC related stimulus programs and the failure to turn budget deficits into budget surpluses post the GFC.
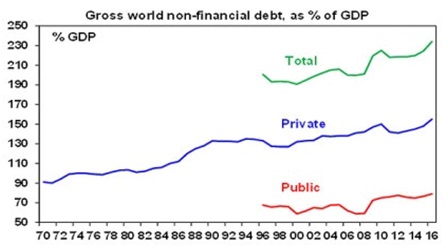
Source: IMF, Haver Analytics, BIS, Ned Davis Research, AMP Capital
The next table compares total debt for various countries.
Total gross non-financial debt outstanding, % GDP
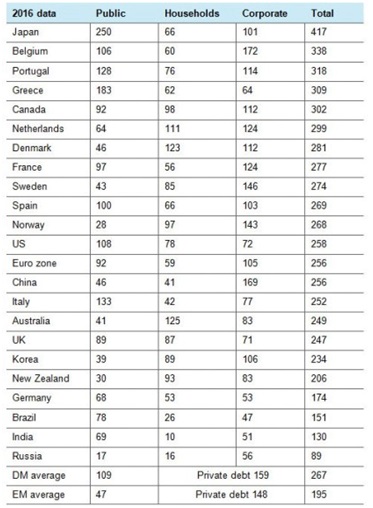
Source: IMF, Haver Analytics, BIS, Ned Davis Research, AMP Capital
There are some qualifications to the table. For example, because of public investments in debt via sovereign wealth funds, central bank reserves, etc, net public debt is usually well below gross debt. In Norway net public debt is -274% of GDP and in Japan its 128% of GDP. So gross debt data exaggerates the total level of debt. But as an overview:
- Japan, Belgium, Portugal and Greece have relatively high total debt levels;
- Germany, Brazil, India and Russia have relatively low debt;
- Australia does not rank highly in total debt – it has very high household debt but its offset by low public & corporate debt;
- Emerging countries tend to have relatively lower debt, but China is an exception given a high level of corporate debt.
But the bottom line is that global debt is at record levels even adjusted for GDP. As a result some fear that any rise in interest rates will immediately derail global growth. Excessive debt can also be associated with slower growth and a higher risk of a financial crisis. Of course it’s not that simple.
Debt, savings and income dynamics
Firstly, the relationship between income, savings and debt is more complicated that often portrayed. The Global Investment Strategy service of Bank Credit Analyst Research (a Canadian research house) recently illustrated this using some simple examples. Suppose there is an island with 100 people, each producing 100 coconuts a year. Here are three possibilities.
Case 1: Output is 10,000 coconuts with each person consuming 100. Saving and investment are zero and no debt is created.
Case 2: Each person consumes only 75 coconuts a year, selling the remainder to a plantation who buys them with a bank loan and plants them resulting in 2500 new coconut trees. Consumption is 7500 coconuts. Savings and investment are 2500 and debt has gone up by 2500 coconuts.
Case 3: Each person consumes 125 coconuts, by importing 25 each. Consumption is now 12,500 coconuts, savings is -2500 coconuts, investment is zero and the current account deficit is 2500. External debt goes up by 2500. This is arguably more risky if foreign islands decide they want their coconuts back!
The point is that debt can rise in an economy even if it lives within its means and invests for the future as Case 2 illustrates. No need for divine retribution here!
Reasons not to be too alarmed about record debt
There are several reasons not to be too alarmed by the rise to record debt levels.
First, the level of debt has been rising ever since debt was invented. This partly reflects greater ease of access to debt over time. But it also reflects the fact that the level of debt is a stock while income is a flow. Suppose an economy starts with $100 of debt and $100 in assets and in year 1 produces $100 of income and in each year it grows by 5%, consumes 80% of its income and saves 20% which is recycled as debt. At the end of year 1 its debt to income ratio will be 120%, but by the end of year 5 it will be 173%. But assuming its assets rise in line with debt its debt to asset ratio will remain flat at 100%. So the very act of saving and investing creates debt and rising debt to income ratios.
Second, China has led the surge higher in private debt in recent years but is an example of Case 2 where it borrows from itself. The main problem in China is that it has a very high savings ratio of nearly 50% of GDP and this saving is largely recycled through the banking system (partly because of a less developed share market) and this results in strong debt growth. But not much of this has gone into the Chinese property market (household debt is low) – rather it finds its way into corporate debt and investment. But this is largely matched by an expansion in productive assets and is really a reflection of fiscal policy and is subject to government support if there’s a problem.
Third, the rise in private debt in the emerging world is not that concerning as they, like younger workers, have a higher growth potential going forward than developed countries. Of course the main problem emerging countries face is that they borrow too much in US dollars and either a sharp rise in the $US or a loss of confidence by foreign investors causes a problem. But there are no signs of the latter and emerging countries seem to have weathered the rise in the $US since 2014 pretty well.
Fourth, debt interest burdens are low and in many cases still falling as more expensive long maturity older debt rolls off. For example despite the recent rise in bond yields US public debt interest payments are less than 3% of US GDP – well down from 4.5% in 1991. And given the long maturity of much debt in advanced countries it will take time for higher bond yields to feed through into actual interest payments. In Australia, interest payments as a share of household disposable income are at their lowest since 2003, and are down by more than a third from their 2008 high. See the next chart. Moreover there is no sign of significant debt servicing problems globally or in Australia – unlike in relation to US sub-prime debt just prior to the GFC.
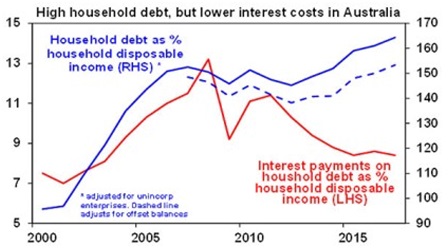
Source: RBA, AMP Capital
Fifth, most of the debt increase in recent years in developed countries has come from public debt and governments can tax and print if worse comes to worse. Japan is perhaps most at risk here given its very high level of public debt but it has borrowed from itself (Case 2 again) and Japan remains one of the world’s biggest creditor nations. And even if Japanese interest rates do rise sharply (which is unlikely with the BoJ maintaining zero 10 year bond yields) 40% of Japanese Government bonds are held by the BoJ so higher interest payments to it will simply be paid back to the Government.
Sixth, when it comes time to raise interest rates central banks will adopt a gradual approach knowing that in an environment of higher debt they don’t need to raise rates as much to have an impact on inflation or growth as had been the case in the past. The gradual approach is currently evident at the Fed.
Finally, increased debt of itself is rarely the source of a shock to economies. Some sort of trigger is required – usually much higher interest rates or rising defaults as economies sour or after a big deterioration in lending standards – as was evident in the US sub-prime crisis. At present these seem unlikely.
Concluding comment and investment implications
None of this is to say there’s nothing to worry about. History tells us that the next major crisis will involve debt problems of some sort. But just because global debt is at record levels and that global bond yields have moved higher does not mean a crisis is imminent. For investors, debt levels are something to keep an eye on – particularly if there is a broad based surge in debt in the context of surging asset prices. At present, apart from pockets of concern (eg, Sydney & Melbourne property markets) there is no sign of this on a generalised basis globally.
Source: AMP Capital 22 March 2017
About the Author
Dr Shane Oliver, Head of Investment Strategy and Economics and Chief Economist at AMP Capital is responsible for AMP Capital’s diversified investment funds. He also provides economic forecasts and analysis of key variables and issues affecting, or likely to affect, all asset markets.
Important note: While every care has been taken in the preparation of this article, AMP Capital Investors Limited (ABN 59 001 777 591, AFSL 232497) and AMP Capital Funds Management Limited (ABN 15 159 557 721, AFSL 426455) makes no representations or warranties as to the accuracy or completeness of any statement in it including, without limitation, any forecasts. Past performance is not a reliable indicator of future performance. This article has been prepared for the purpose of providing general information, without taking account of any particular investor’s objectives, financial situation or needs. An investor should, before making any investment decisions, consider the appropriateness of the information in this article, and seek professional advice, having regard to the investor’s objectives, financial situation and needs. This article is solely for the use of the party to whom it is provided.
Interwest Financial Services Pty Ltd ABN 99 008 956 876, Gary Powell, Ben Walker, David Wrightson, Andy van Geyzel are Authorised Representatives and Credit Representatives of AMP Financial Planning Pty Limited ABN 89 051 208 327 AFS Licence No. 232706. This article contains general information only. It does not take into account your objectives, financial situation or needs. Please consider the appropriateness of the information in light of your personal circumstances.
Interwest Financial Services
6 Charles Street, South Perth WA 6151 Australia
PO Box 263, South Perth WA 6951
T : 08 6436 0000 Email: advice@interwest.com.au
F : 08 6436 0099 Website : www.interwest.com.au